Get started with QGIS
Overview
Teaching: 20 min
Exercises: minQuestions
How do we add a vector data into QGIS?
How do we map X and Y Coordinate into QGIS?
How do we add a basemap and a plugin into QGIS?
Objectives
Know how to add vector data into QGIS.
Know how to add delimited file into QGIS and map them.
Know how to add a basemap into QGIS.
Learn how to add a plug in into QGIS
Familiarize yourself with QGIs
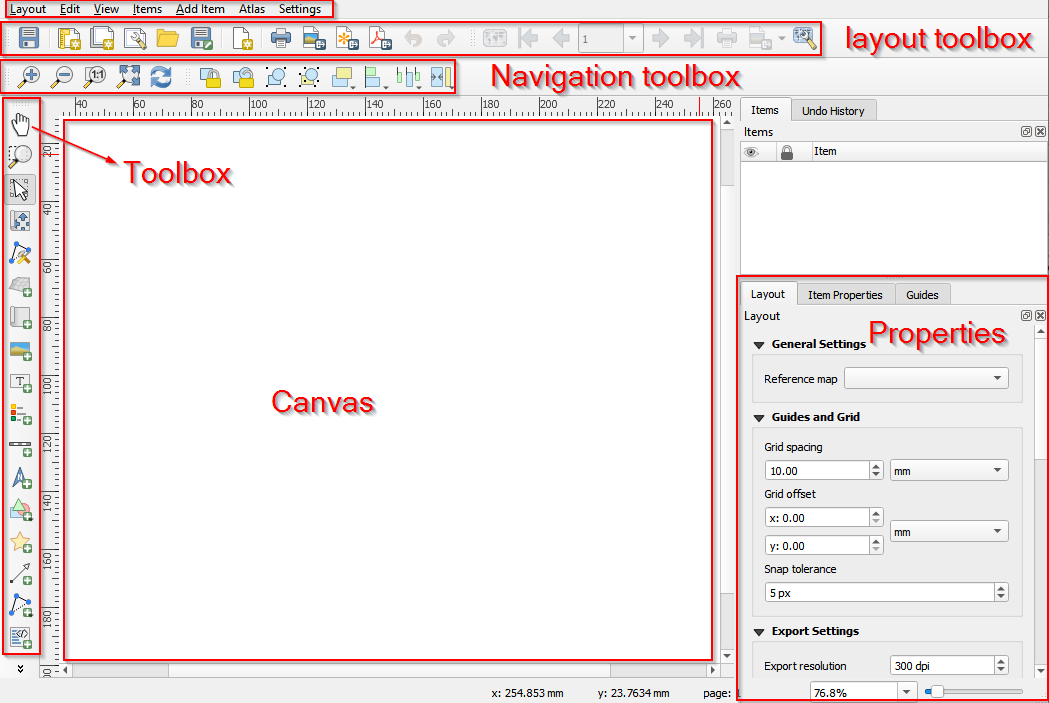
1.The main area of QGIS is called the canvas. There are also panels and toolbars, a status bar and menu panels.
2.Panels and toolbars may be moved around and docked at different locations (left-click and
hold to initiate this flexibility). If you drop a panel on top of another, they will be nested into tabs. Panels you do not used can be removed. Toolbars can be moved around in much the same way, but you cannot nest toolbars into tabs. By right-clicking in the toolbar area, you may get a list of available panels and toolbars you can turn them on and off as you like.
3.Through the menu, you can access almost everything in QGIS; some functions have buttons,
and keyboard shortcuts as well.
4.The status bar shows relevant information about the current tool or aspects of the map canvas, like coordinates and scale.
5.Toolbox is where you can search for all the tools provided in QGIS. If you can see the toolbox as the figure shows, you can open it in the menu (Processing->Toolbox).
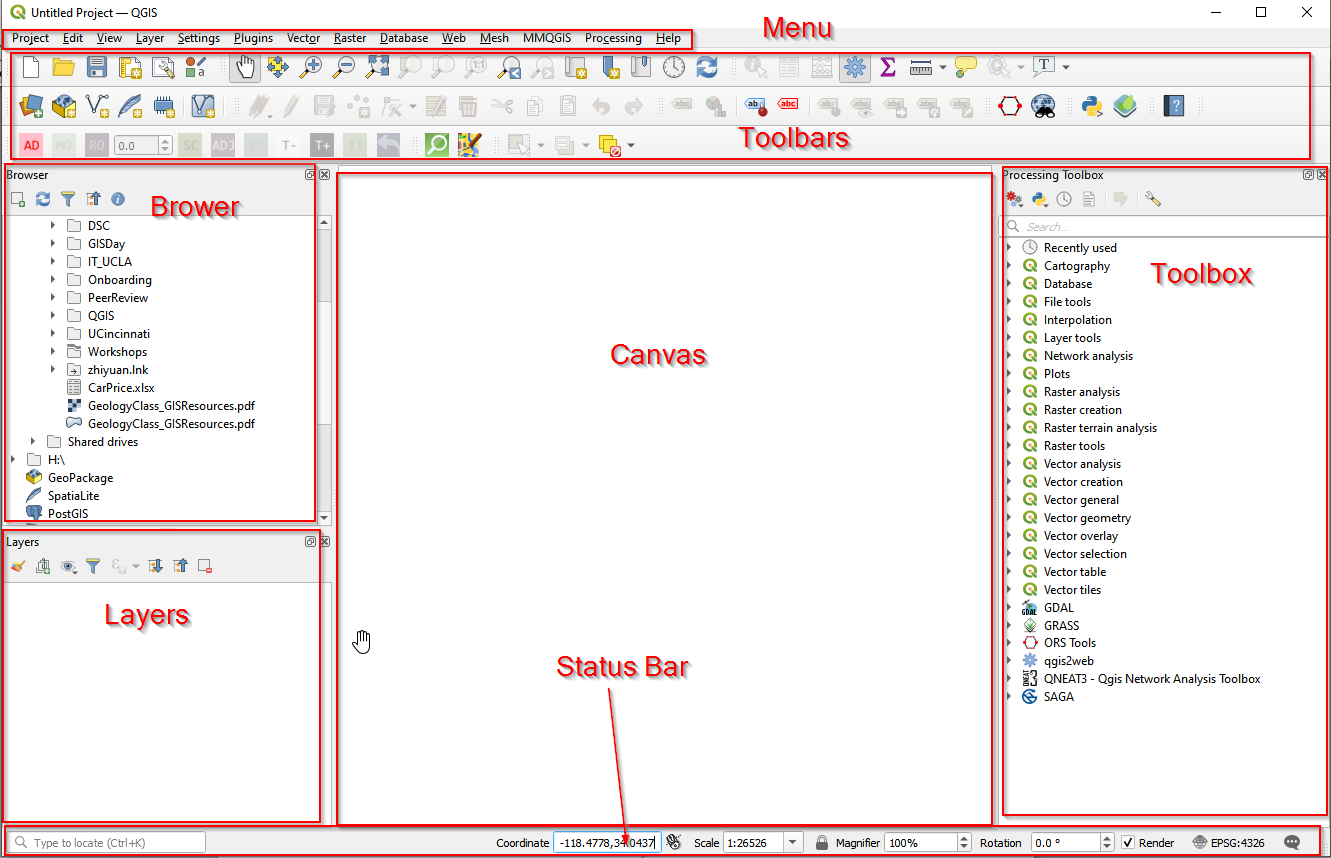
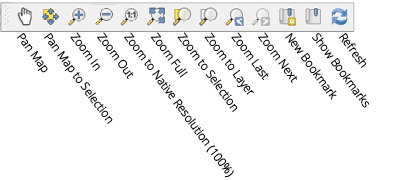
6.Use the map navigation toolbar to help navigate your map in the canvas. Here you can find tools to pan and zoom the map, zoom to selected features, and view the complete extent of the map or selected layer. You can also jump to a previous extent with dedicated buttons.
Add data to QGIS
To start, we need to download the data first. There are two shapefiles: Grocery stores Download, and Neighborhood boundary Download, and a csv file: Apartments Download.
Add vector data
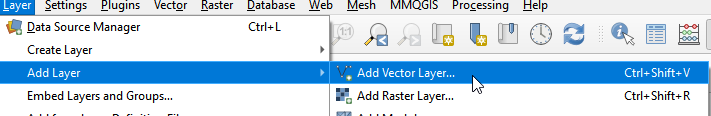
- a. Left-click the “Layer” menu option, hover over “Add Layer,” and left-click the “Add Vector Layer” option.
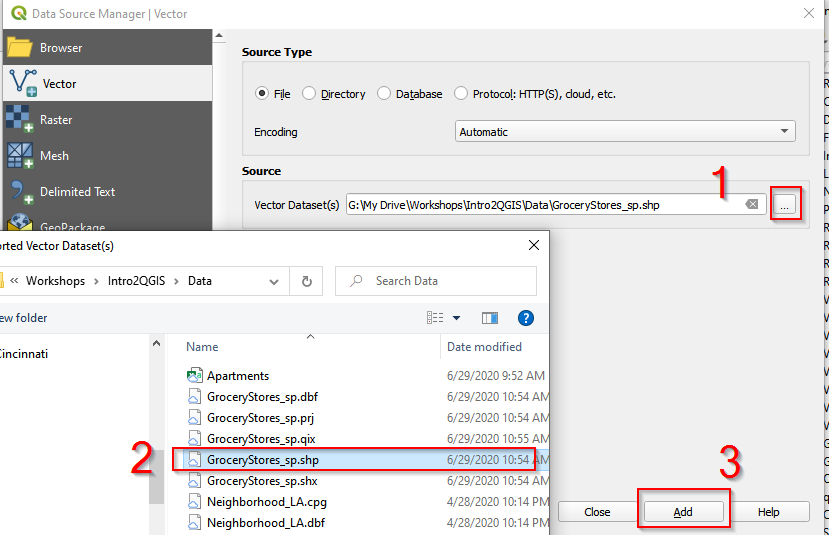
| 2.In Data Source Manager | Vector window, click the button and navigate to the folder where the data is. Once select GroceryStores_sp.shp, click Add. |
3.Follow the same procedure and Add Neighborhood_sp.shp.
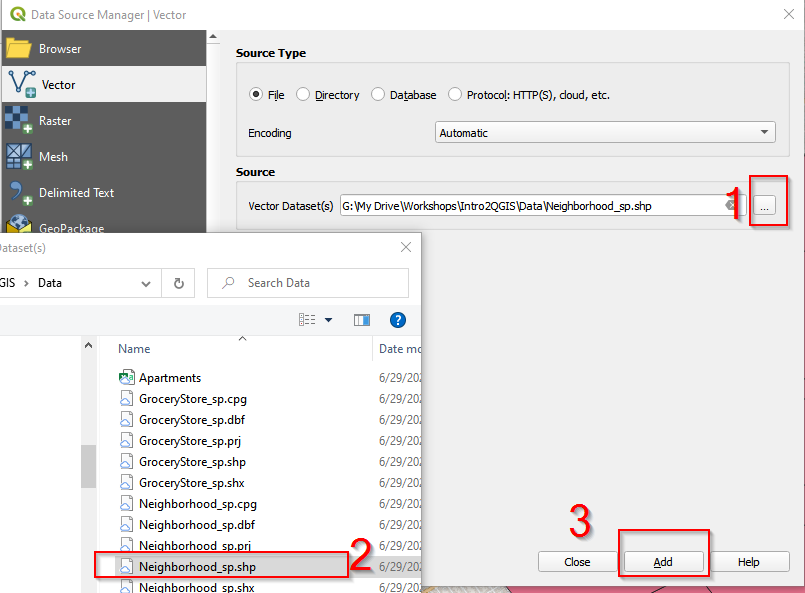
-
After adding GroceryStores_sp.shp and Neighborhood_sp.shp, close the Data Source Manager Vector window.
Add delimited file
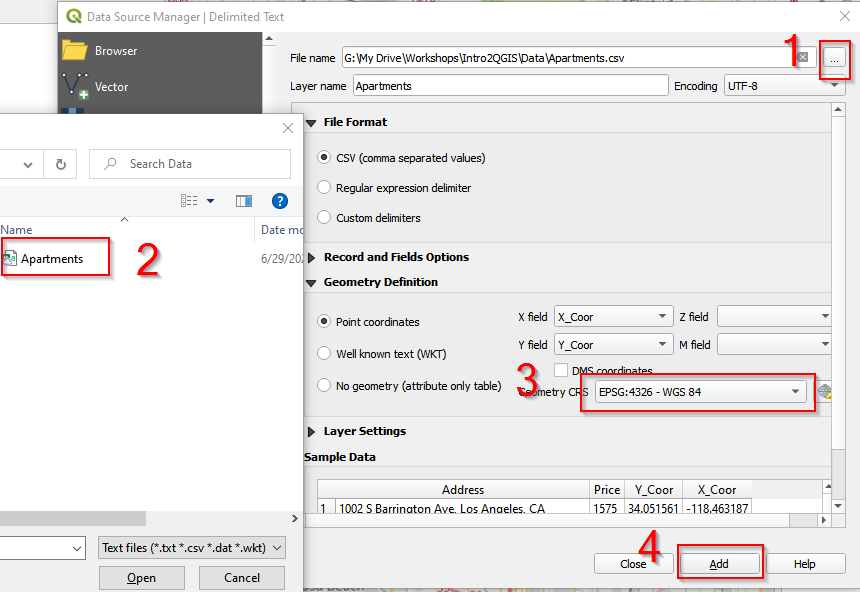
QGIS can convert X Y Coordinates into locations on a map. Open Apartments.csv and you can see X_Coor and Y_Coor columns. These are geospatial information for these apartments. We can map X_Coor and Y_Coor as a point layer in QGIS.
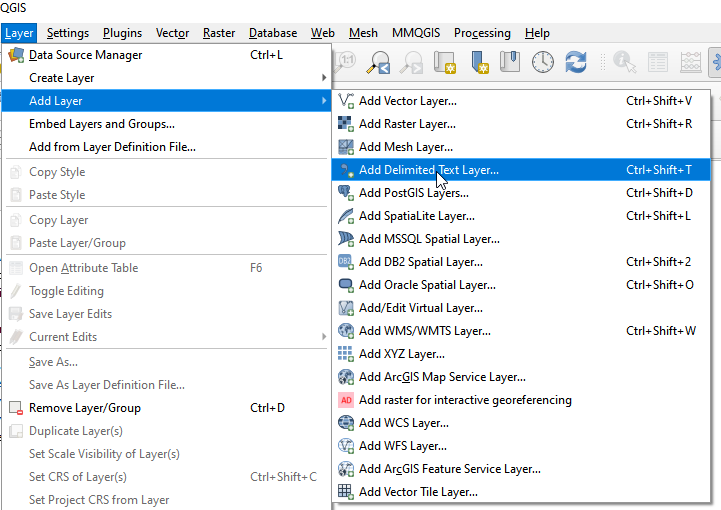
- In the menu bar, click Layer, then Add layer, and choose Add Delimited Text Layer.
-
b. In the Data Source Manager Vector window, 1) navigate to the Data folder and 2) choose Apartment.csv. 3) Make sure Geometry CRS is EPSG: 4326 – WGS84. 4) Click Add. Close the Data Source Manager Vector window. Apartments should show in the Canvas.
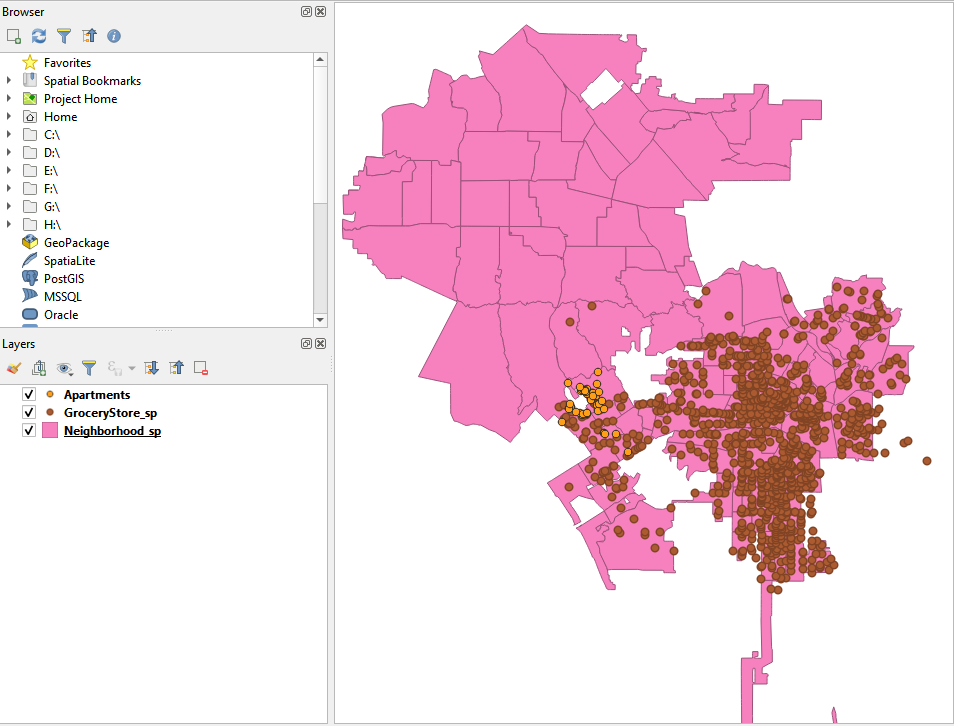
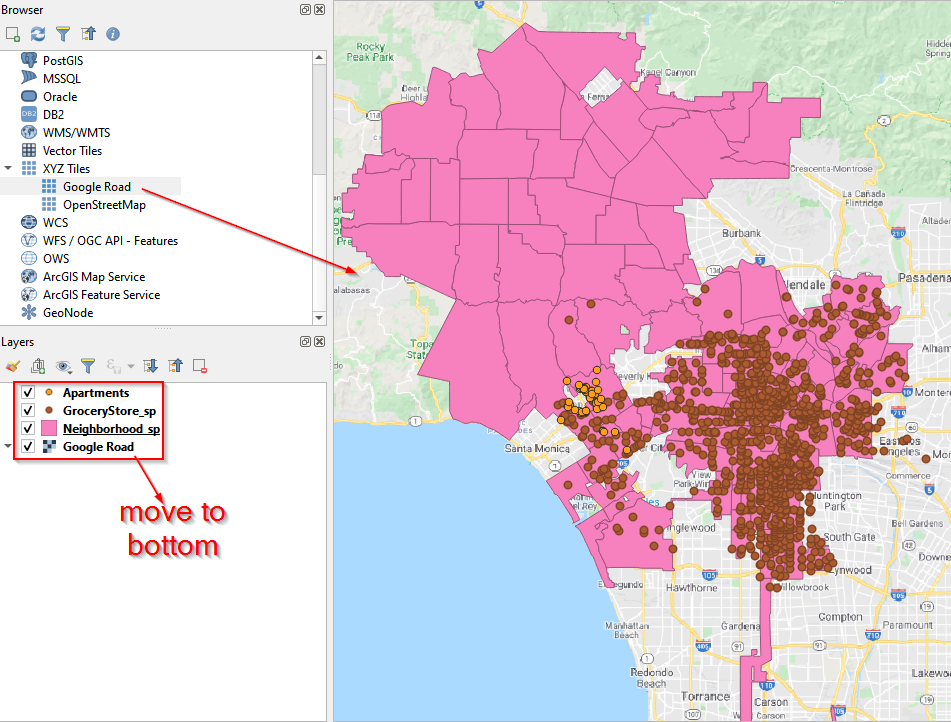
3.The Canvas looks like the following. There are two points layers (Apartments, and GroceryStore_sp), and one polygon layer (Neighborhood_sp).
Add a basemap
QGIS provides access to a variety of online base maps. You can add these base maps by building XYZ Tiles connections. Here we add Google Road/Streets as the base map for the project.
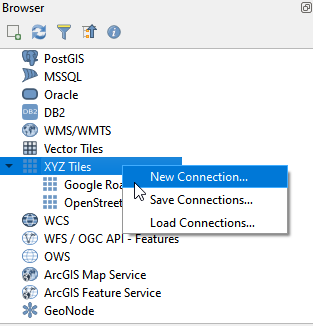
- Find XYZ Tiles in Brower. Right click XYZ Tiles.
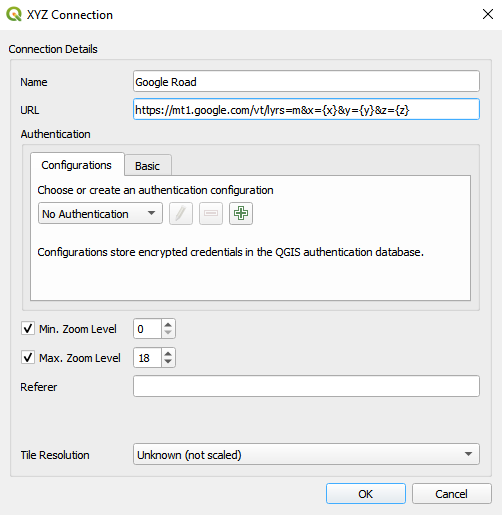
- In the XYZ Connection window, name the new XYZ Tile as Google Road/Streets, and copy https://mt1.google.com/vt/lyrs=m&x={x}&y={y}&z={z} into URL. Click OK.
- Drag Google Road into the Canvas and move Google Road layer to the bottom in Layers Panel.
Add a plugin
As an open source software, QGIS have an active community constantly contributing to a variety of tools by developing QGIS plugins. We will use a MMQGIS plugin in this project.
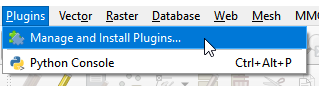
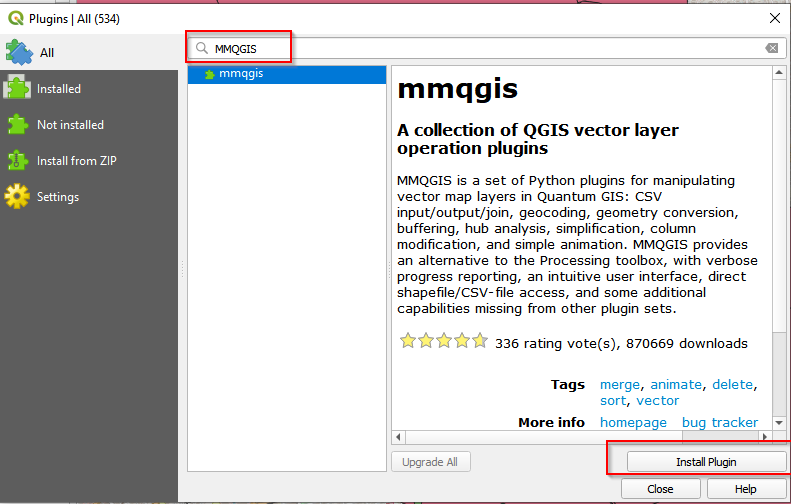
- To add a plugin, go to Menu, and click Plugins. Then click Manage and Install Plugins.
-
In the Plugins window, search for MMQGIS. Click the mmqgis and then Install Plugin.
-
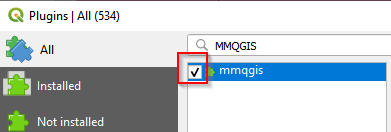
After installation, check the box in front of mmqgis.
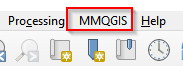
- With successful installation, you should see the MMQGIS in the Menu bar.
Key Points
Vector data use X and Y coordinates to define the loctions of points, lines, and areas (polygons) that correspond to map features.
To map a delimited file, the file need to have geospatial information (e.g. X Y Coordinates).
X Y Coordinates are longtitude and latutide in degrees. WGS 84 is the most often used geodetic datum to represent coordinates
A variety of basemap can be added to QGIS through adding an XYZ Tile layer.
Spatial Analysis in QGIS
Overview
Teaching: 40 min
Exercises: 0 minQuestions
How can we find apartments that meet the student’s criteria?
Objectives
Understand what projections are.
Project a layer under a suitable projection.
Be able to creat buffers.
Be able to count points with buffers.
Be able to join attribute tables.
Be able to select features by attributes.
Projection
Before we do the spatial analysis to find the suitable apartments, we need to project the Aparments layer. The Apartment layer is converted from a csv and the locations are derived from X and Y coordinates. X and Y coordinates are longtitudes and latitudes which represent locations on a global. We need to project the locations onto a “a flat piece of paper” before we do the analysis.
Projecting a map into different projections means drawing the earth surface onto a “a flat piece of paper”. There are a variety of methods to “draw”, among which there are three major methods: planar (left), conic (middle), and cylindrical (right) projections.
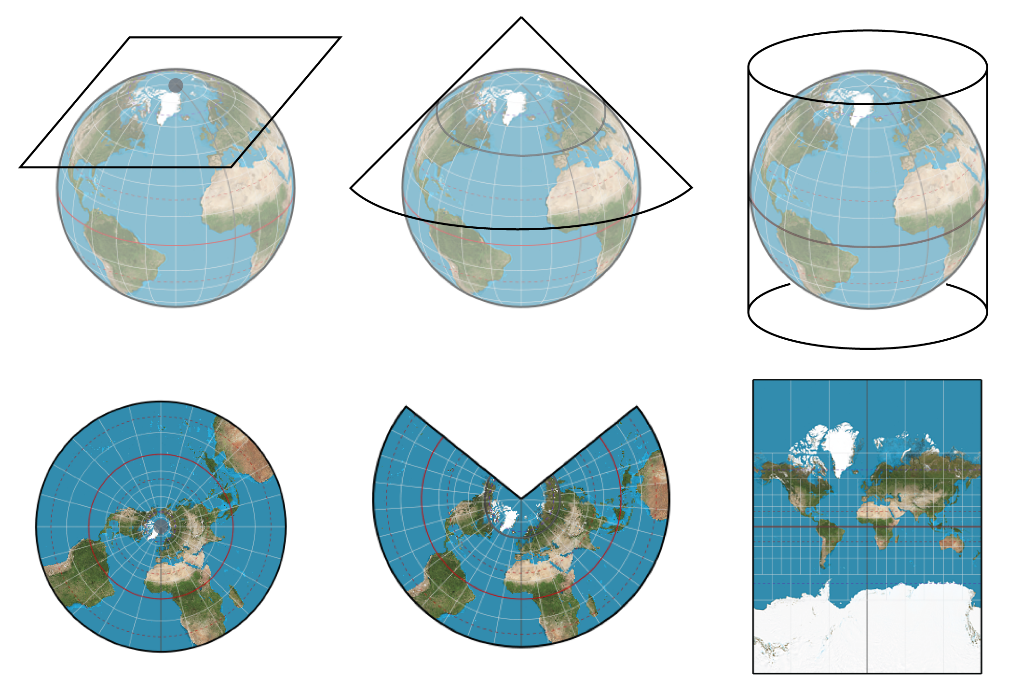
Different Projections Source
The Apartments layer we mapped into QGIS canvas are locations represented by X and Y Coordinates (latitude and longitude on the Earth surface). To analyze the layer, we need to project the Apartments layer from latitude and longitude (unit in degrees) to a “flat paper” using a suitable method. We will project the Apartments layer into NAD83(2011)/California Zone 5.
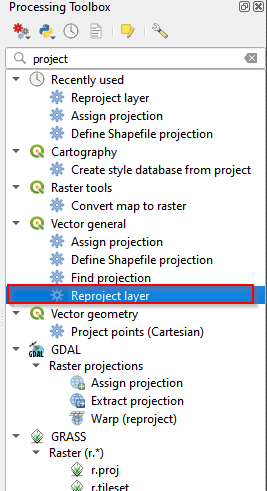
- Go to Processing Toolbox and search for projection. If the Processing Toolbox does not show on the right panel of QGIS layout. Go to the Menu, Processing, and Click Toolbox.
- Select Reproject Layer.
Reproject layer
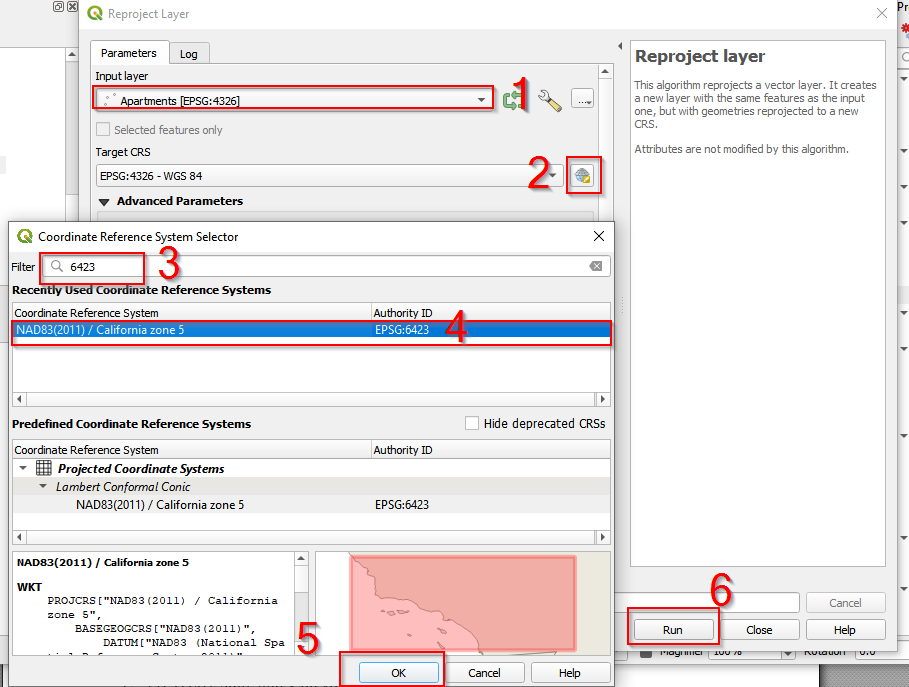
- In the Reproject Layer
- (1) choose Apartmets
- (2) click the button to select projections
- (3) type in 6432 in the Filter
- (4) choose NAD83(2011)/California zone 5
- (5) Click OK
- (6) After the configuration, Cilck run.
Find NAD83(2011)/California zone 5 projection
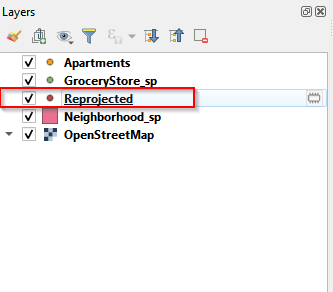
- Once the projection is done, you can find there is a new layer named Reprojected showing up in the Layer panel.
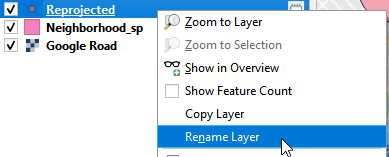
Rename teh reprojected layer
- Rename the Reprojected layer as Apartment_sp. Sp means State Plane, which is the projection system specifically for United States. NAD83(2011)/California zone 5 is a part of State Plane Projection.
Rename the layer
Save the reprojected layer
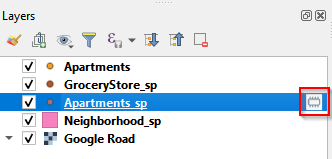
- Looking at the renamed layer: Apartments_sp, you can find there is a button (looks like a caterpillar). This button indicates the layer is a temporal layer and is not saved. To save this layer, click the “caterpillar” button, a Save Scratch Layer window pops up.
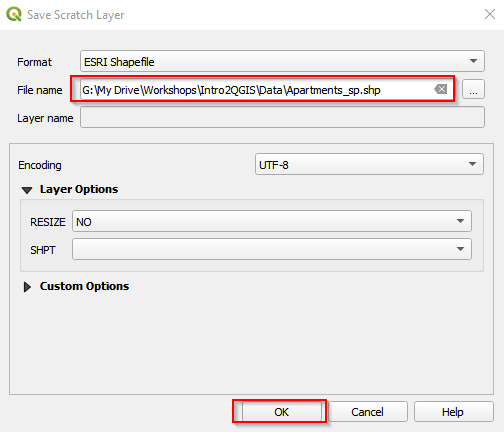
Save the scratch layer (a)
- Name the file as Apartments_sp and save it in your working folder. Click OK.
Save the scratch layer (b)
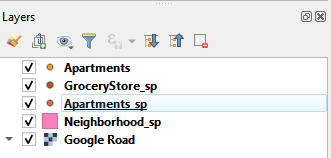
- After saving the layer, go back and check the Apartments_sp in the Layer panel. The “caterpillar” button disappears, indicating the layer is saved.
Save the scratch layer (c)
To find out which places are suitable for the student, we set two criteria:
- there are at least 2 grocery stores within 400 meters of the buffer centered at the Apartments.
- Price is less than $1300. According to a study, a distance of 0.25 miles is often used as an accepted in U.S. research studies. We set 400 meters as the walking distance to make buffers around apartments. The price is set arbitrarily. You can set different price thresholds to compare the different result.
To meet the criteria, we need to
- make 400 meters distance buffers centered at apartments
- count the number of grocery stores with the buffers
- join the buffer’s attribute to apartments layer
- select the targeted apartments
Create walking distance buffers
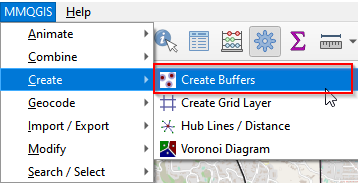
- Go to Menu bar and find MMQGIS (the plugin installed). Click Create Buffers.
Create buffers
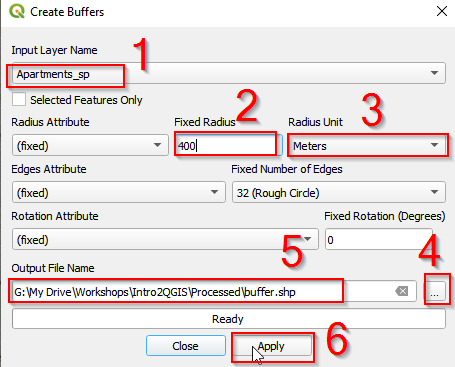
- In the Create Buffers window
- (1) select Apartments_sp. This is the layer that we will center to create buffers.
- (2) Set the radius as 400
- (3) Unit is meters
- (4) Click the button to save the buffers.
- (5) Save as buffer.shp
- (6) Click OK.
Create buffers around Apartments layer
- The buffer layer should show up in the Layer panel.

BUffer the layer panel
Count points within buffers
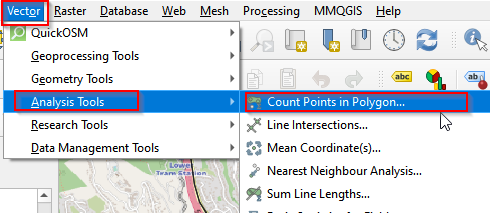
1.In the Menu bar, find Vector. Go to Analysis tool and Click Count Points in Polygon.
Count points in polygon (a)
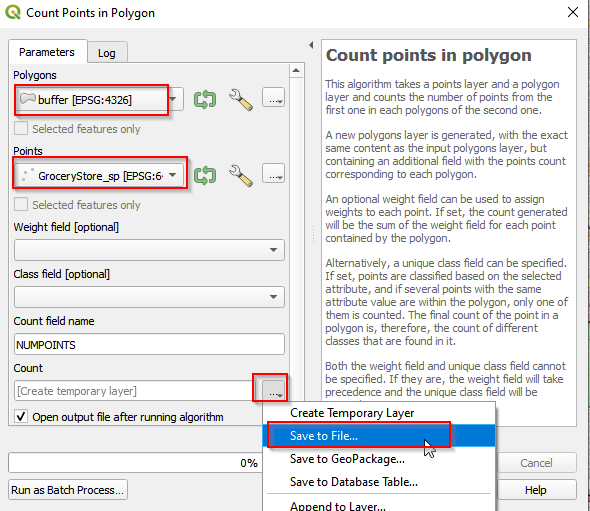
- Select buffer for Polygons, GroceryStore_sp for Points. Then go to Count and Click Save to File.
Count points in polygon (b)
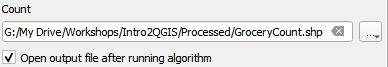
- Navigate to the Save the output as GroceryCount.shp. The saved file should show up in the Layer Panel.
Save the GroceryCount layer
Join attribute layer
We counted the number of grocery stories with each buffer, and the information is stored in GroceryCount Layer. Let’s check the attribute table, find the information (NUMPOINTS) and join the attribute table to Apartments_sp.
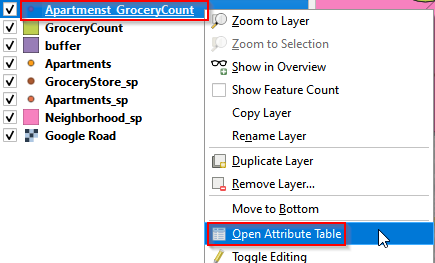
- Right-click GroceryCount and Open Attribute Table.
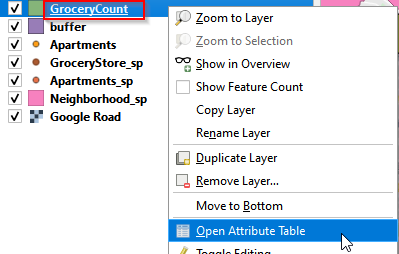
Open attribute layer
- There are 5 attributes (columns) in the table, and the last one is NUMPOINTS. This is the number of grocery stores in each 400 meters buffer.
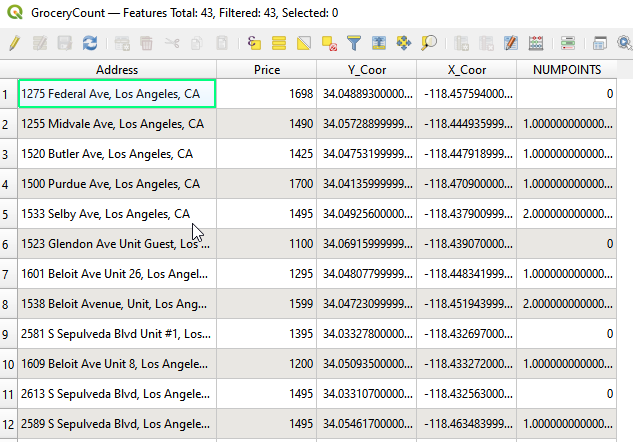
Attribute table of Grocery Count layer
- To join GroceryCount’s attribute table to Apartments_sp, we need to
- (1) open Apartments_sp attribute table
- (2) find the shared column, and join. Right click Apartments_sp and Open Attribute Table.
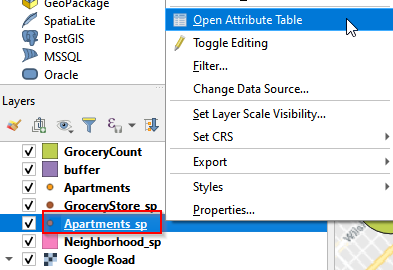
Open attribute table
- Comparing the two attributes tables, both GroceryCount and Apartments_sp have Address column. We will use Address as the shared column to join these two tables.
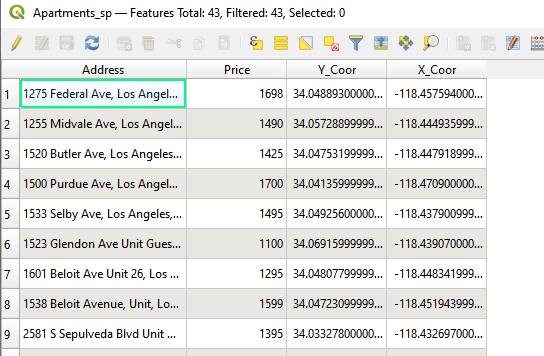
Attribute tbale of Apartments_sp layer
- Go to Processing Toolbox, and type in Join in the search bar. Select Join attributes by field value.
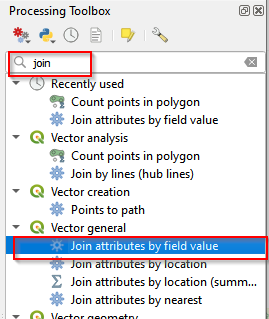
Join in processing Toolbox
- In the Join Attributes by Field Value window, choose Apartments_sp as the Input Layer and Address as Table field. Choose GroceryCount as Input Layer 2 and Address as Table field 2. Click Run.
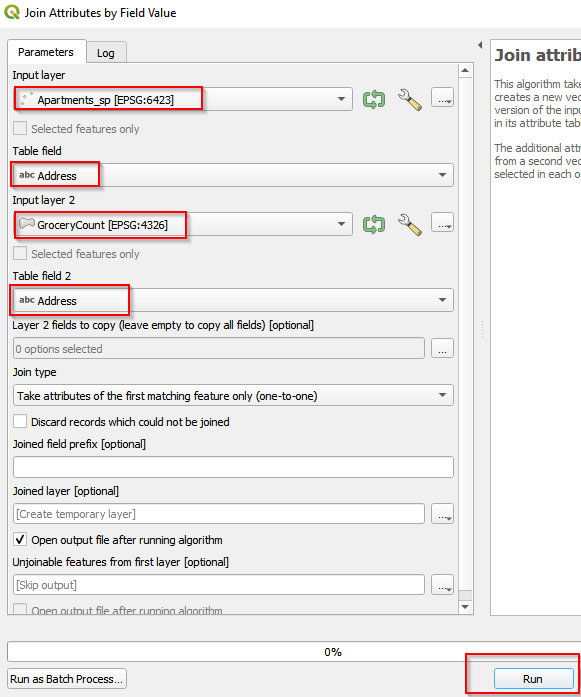
Join tables by field value
- A Joined Layer shows up in the Layer Panel. Right-Click it and rename the layer as Apartment_GroceryCount.
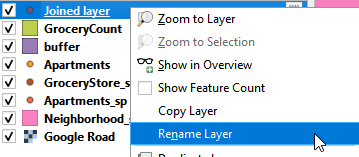
Rename Joined Layer
- here is a “caterpillar” button, indicating this is a scratch layer that is not saved on local drive. To save it, click the “caterpillar” button and save it as Apartment_GroceryCount.shp.
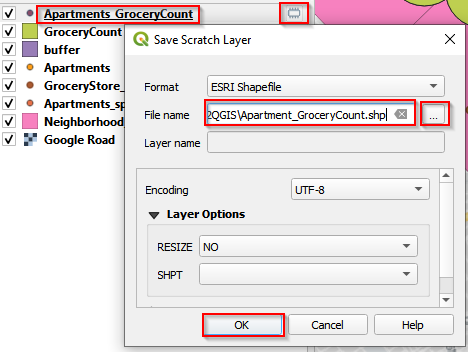
Save Apartments_GroceryCount
Select feature class by attributes
To select by attributes, we need to open attribute table and look at how many attributes the table has and which attribute we will analyze.
- Right click Apartments_GroceryCount and Open Attribute Table.
Open attribute table of Apartments_GroceryCount
- There are total 443 records with 11 columns (attributes). Click the Select feature using an expression.
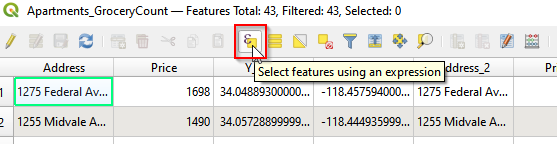
Select by expression (a)
-
Go to Expression tab. There are three panels in the window, expression (left), a list of functions (middle), and explanation of functions (right). Choose functions from the middle panel.
-
Click the functions from Fields and Values and Operates in the middle panel and make the expressions: “NUMPOINTS” >= AND “Price” <= 1300. Then click Selected Features.
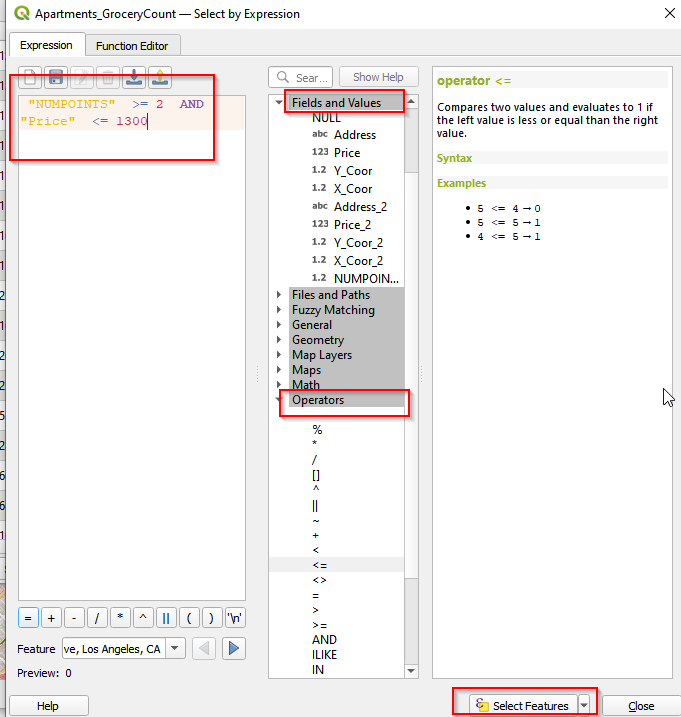
Select by expression (b)
- You can see the selected features are highlighted in the Canvas. There are 2 apartments selected.
Export teh selected feature class
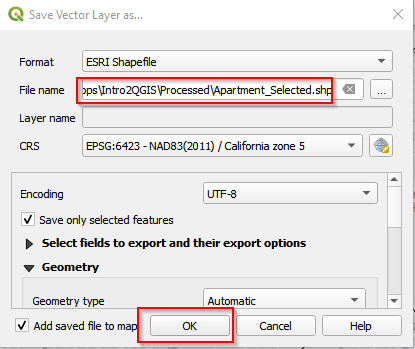
- Right click the Apartments_GroceryCount. Choose Export and click Save Selected Features As.
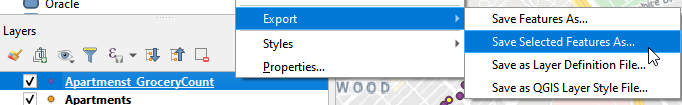
- Save the selected features as Apartment_Selected.shp. Click OK.
Save selected features (b)
Invert Selection
Saving the selected apartments, we Invert selections and export the apartments that are not selected. We need the unselected apartments for mapping later.
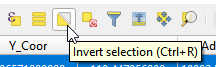
- In the attribute table, click the Invert selection button. The selection changes into the rest of the unselected apartments.
Invert selection
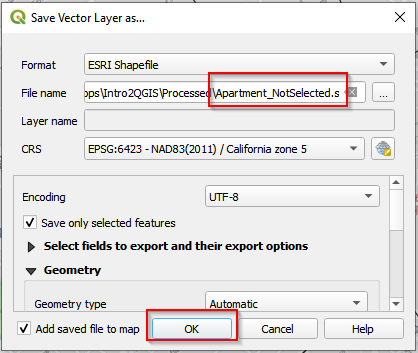
- Export the new selection as Apartment_NotSelected.shp.

Save selected features (c)
Save selected features (d)
Deselect the selected feature class
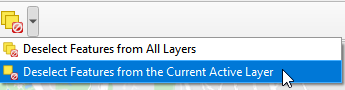
After exporting Apartment_Selected and Apartment_NotSelected, go to the Tool bar in QGIS and Click Delected Features from the Current Active Layer. This will deselect the selected features in Apartement_GroceryCount layer.
Deselect features from the current active layers
Key Points
Projection is the way to convert locations in a global onto to a flat plane.
Choosing a right projection for a study area is crucial before any spatial analysis.
The radius of created buffers is measured by Eucilidean distance.
Change layer properties
Overview
Teaching: 15 min
Exercises: 0 minQuestions
How do we change symbology of layers?
How do we add lables to layers?
Objectives
Know how to Change symbology of layers.
Know how to add labels.
Next, we will change the layer properties:
- change the symbology
- label the map.
Symbology
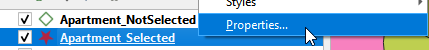
- Right click Apartment_Selected and choose Properties.
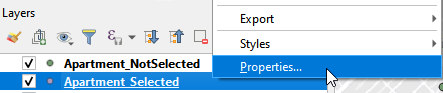
Open Properties window (a)
- Select Single Symbol. Click Marker and select effect drop shadow.
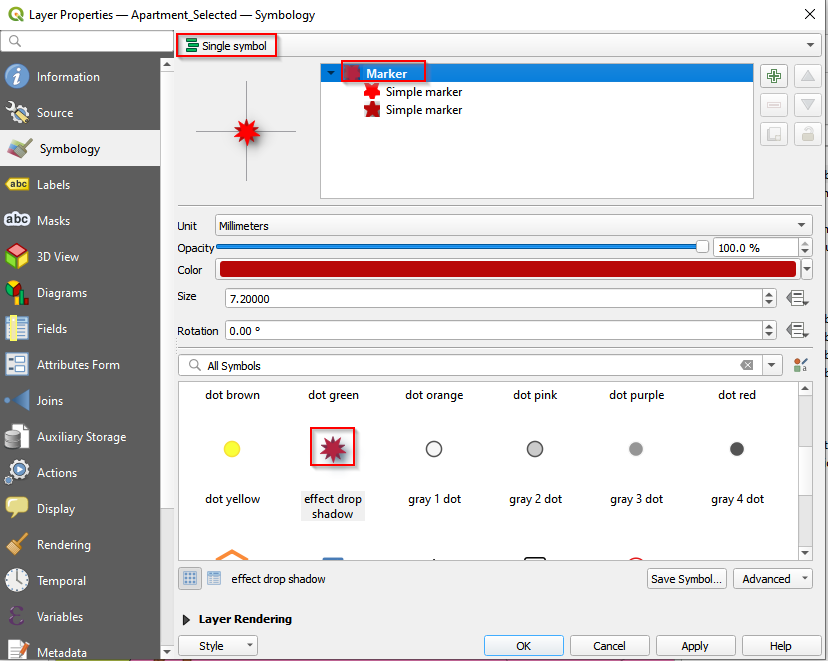
- Select the second Simpler maker and remove it.
1Figure 55. Delete the Single Marker
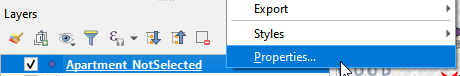
- Switch to Apartment_NotSelected layer and open Properties.
- Also select Single symbol. Choose diamond green.
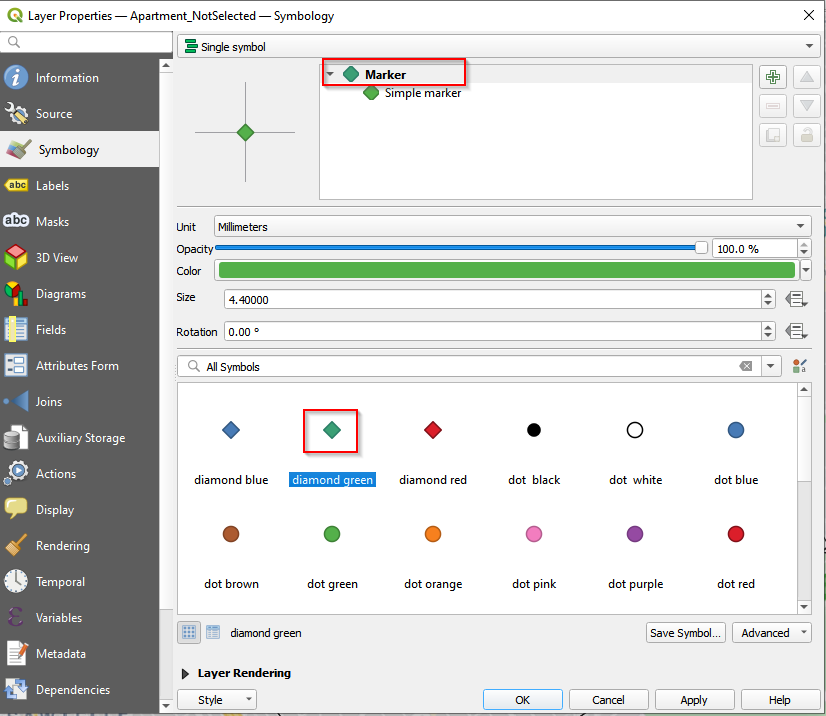
- Select the Simple Marker. Go to Fill color and check Transparent Fill.
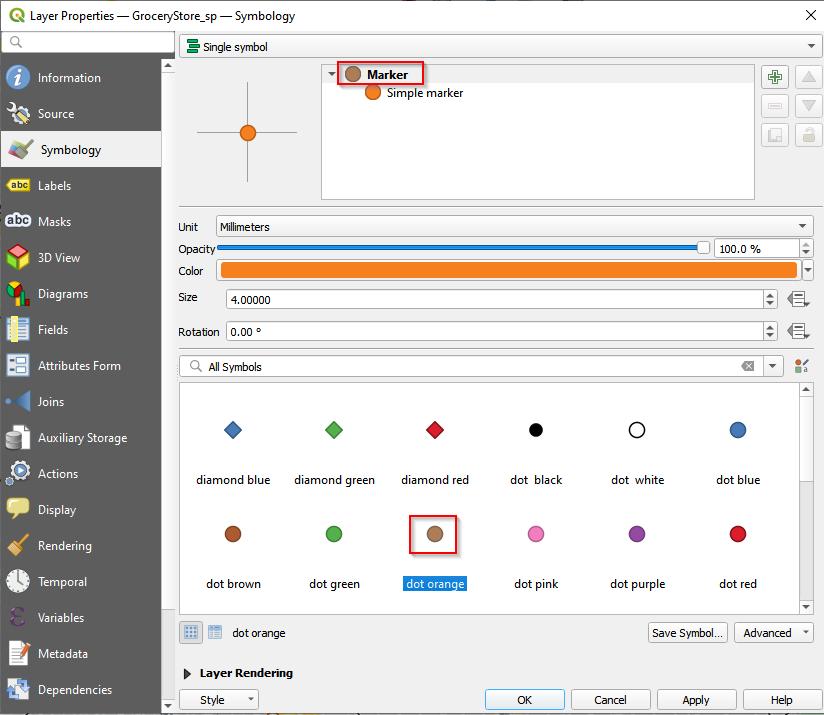
- Change the symbol of GroceryStore_sp. Go to the Properties.
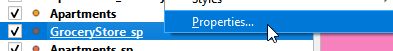
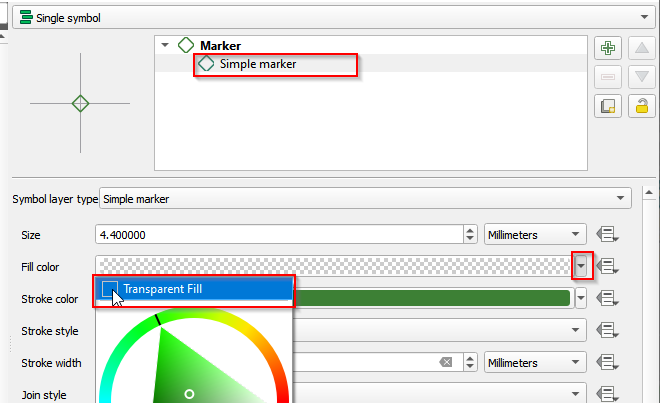
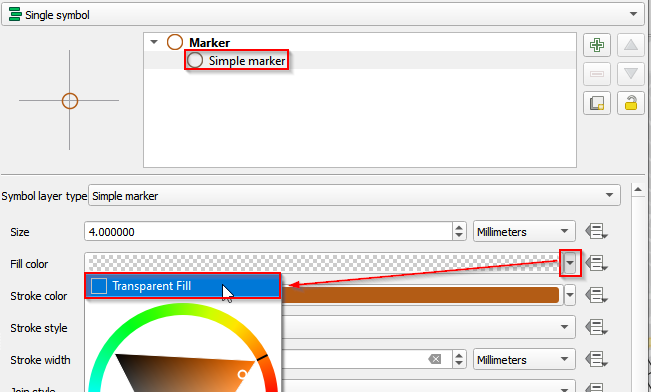
- Follow the similar procedures of changing the symbol for Aparment_Selected to change the Marker for GroceryStore_sp. Choose dot orange and make the marker transparent.
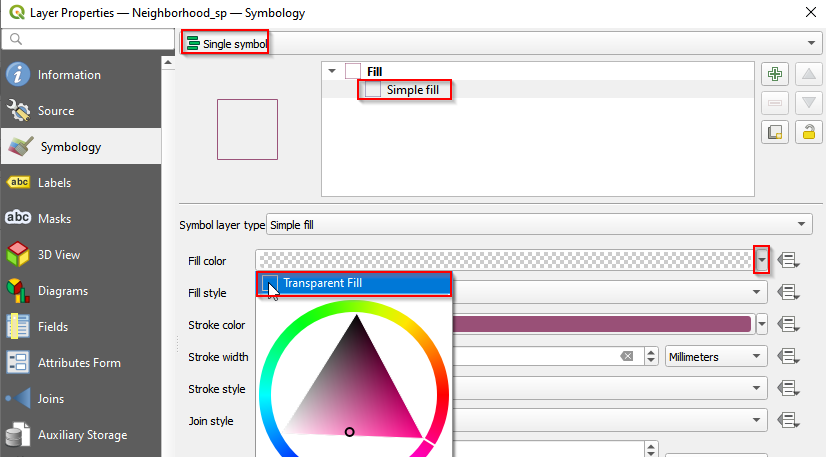
- Change the symbol for Neighborhood_sp layer. Open properties. Choose Single symbol and click Simple fill. In Fill color, check Transparent Fill.
Add labels
We want to label the selected apartments with the prices.
- Open Properties of Apartment_Selected layer.
- On the left panel, select Labels. On the right panel, from the top select Single Label. Select Price for Value.
Key Points
Make the point hollow to show overlapped points.
Use contrasting colors to highlight the points against the basemap.
Creat print layout and Save the project
Overview
Teaching: 15 min
Exercises: 0 minQuestions
How do we to create a new print layout?
What are the basic elements for a map?
How do we export and save the map?
Objectives
Learn the basic elements of map.
Know how to organize the elements in a map and change the properties of the elements.
Know to how export the map and save the project.
Create the print layout
Changing the properties of the layers, we are ready for making and exporting a map.
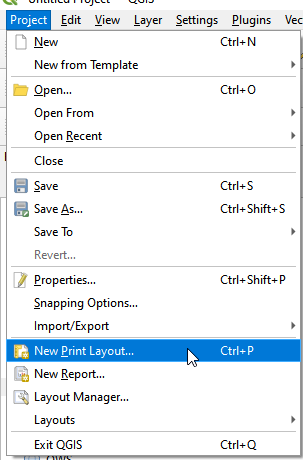
- In the Menu, find Project and choose New Print Layout.
New print layout
- Name the print layout as House Hunting Plan
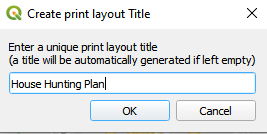
Name the new print layout
- The layout of the Print Layout.
Layout of the new print layout
- Use the tools in the Toobox bar to draw rectangles in the Canvas and add different elements for a map, such as title, map, legend, north arrow, and scale.
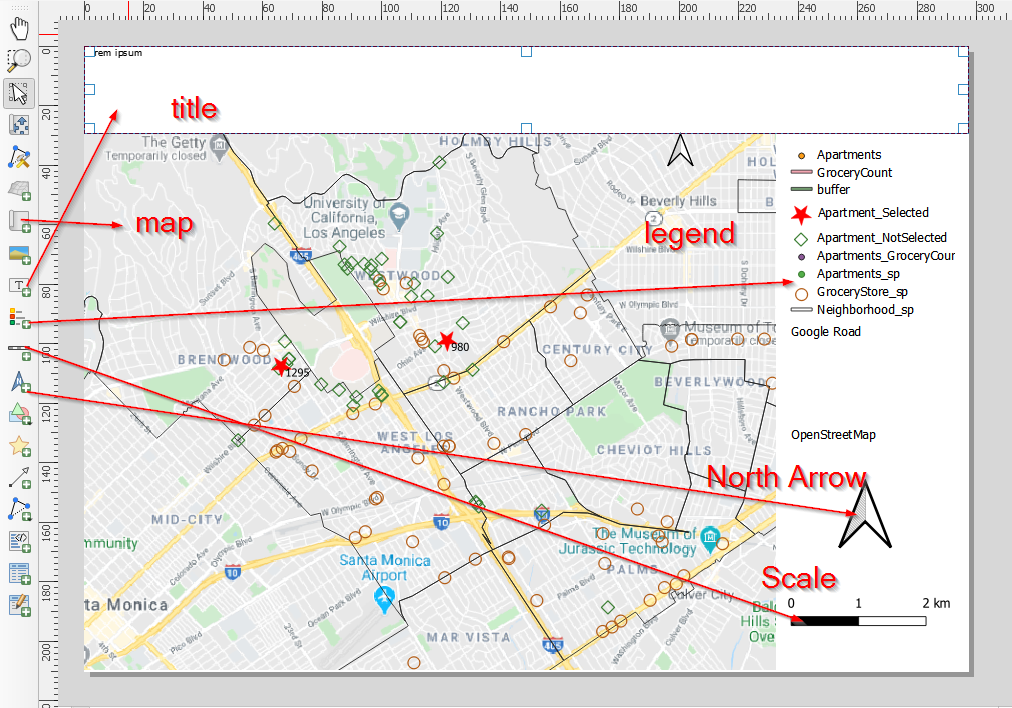
Add elements to make a map
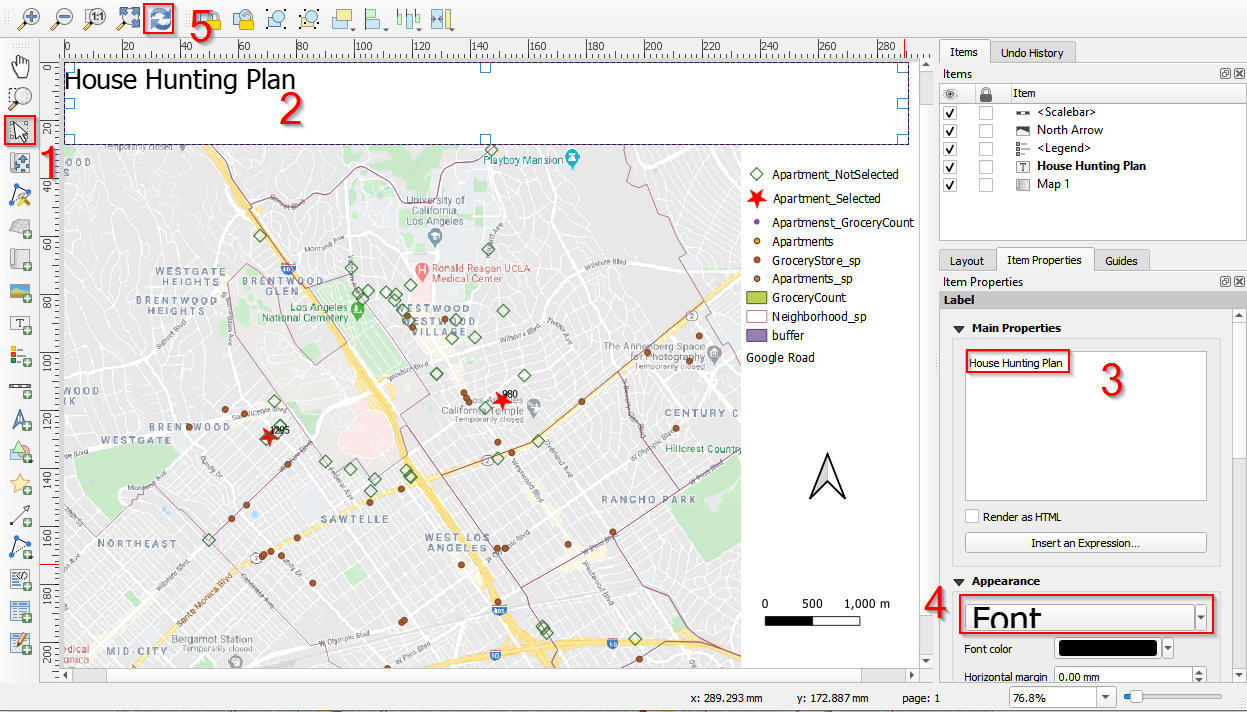
-
- (1) Click Select/Move item button in the Toolbox bar
- (2) select the title.
- (3) In the Properties panel, change the title as House Hunting Plan.
- (4) Move blow and change the Font to fit the map. If there is no change after changing the properties
- (5) click refresh.
Change properties of the title
- Scroll down the Properties panel, select Center for Horizontal alignment and Middle for Vertical alignment. Check Frame to add the frame to the title.
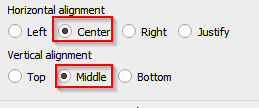
Center the title horizontally and vertically
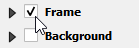
Add frame to the title
- Select the map and add a frame to the map in the Properties panel.
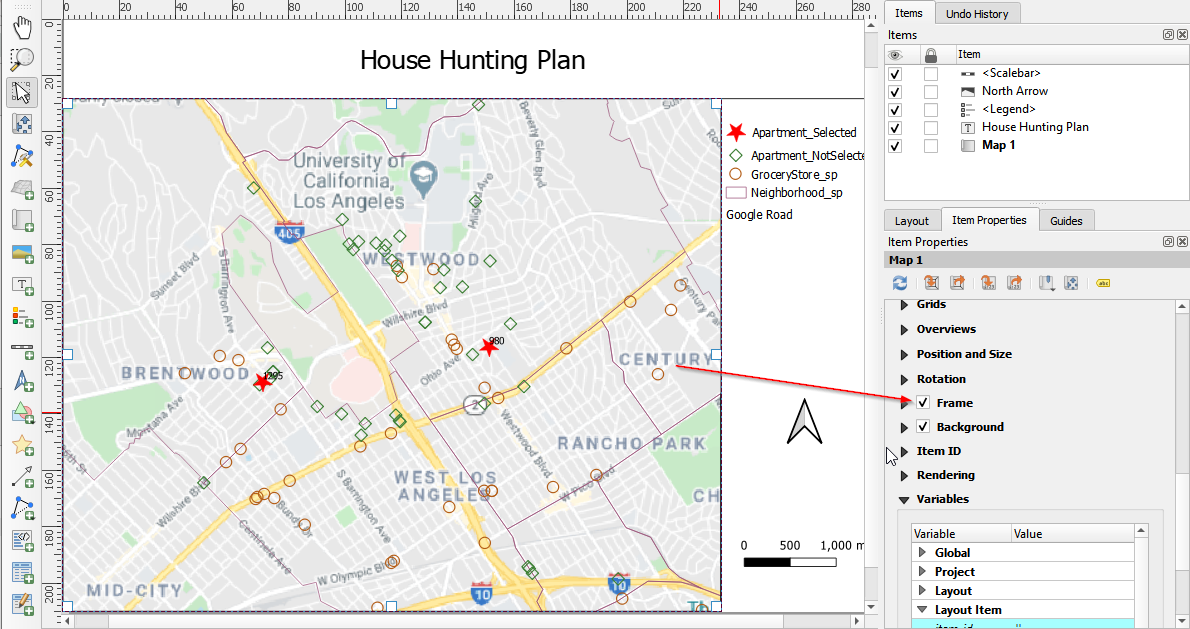
Add frame the map
- Click the legend and change the properties of legend. Uncheck Resize to fit contents and Auto update. Delete some layers and only keep the layers we want to show in the map: Apartement_Selected, Apartment_NotSelected, GroceryStore_sp, Neighborhood_sp, and Google Road.
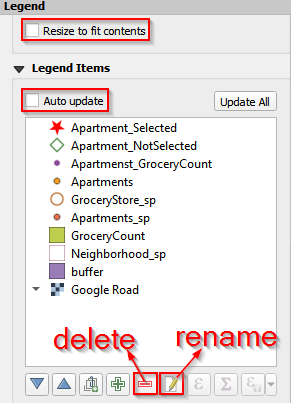
Customize the legend (a)

Customize the legend (b)
- Rearrange the positions of the elements (title, north arrow, scale, legend, and map) to make a nice map.
Export as Pdf, image or SVG
The map can be exported/saved as image (jpg, png, etc.), SVG (a format using for html file), and pdf. We save the map as an image (jpeg) for this project.
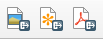
Export the map
Save the project
We did a simple spatial analysis and made the first map! Good job! Next step is saving the project.
- In the print layout window, click Layout in the Menu bar. Save Project. This will save both the edited map and the print layout.

Save the project from print layout view
- Another way to save the project is: switching back to QGIS layout view, choosing Project and Save the project as HouseHuntingPlan.
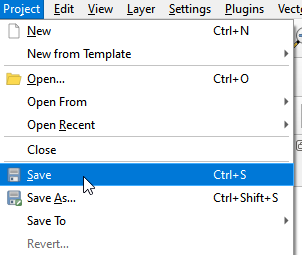
Save the project from main menu
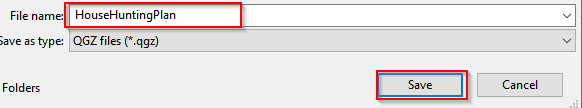
Save the project as HouseHuntingPlan
Key Points
The basie elements for a maps are scale, legend, north arrow, title, and the content.
You can save the map in three types: pdf, image, and SVG.